| |
I hope you're having a wonderful start to Spring. Recently I have gotten a lot of questions about what impact the tariffs and other economic conditions might have on the real estate market. While many predict that there may be a shift nationally from a seller's market to a buyer's, in NYC we like to buck the trend. I am no economist or fortune teller, but my expectation is that barring an economic catastrophe, lower mortgage interest rates will continue to revive our market and bring demand and prices up in the short term.
Data for 2025 so far seems to support this view, with all indicators of demand up substantially this quarter versus last year. Brooklyn continued to be impervious to it all with cutthroat competition especially in the townhouse sector.
While it remains to be seen how the rest of the year will play out, a strong foundation from this quarter will hopefully set the stage for a relatively healthy 2025 market that is able to withstand fluctuations in other financial markets.
If you've been considering buying or selling, we'd love to speak to you and help you navigate this interesting market. |
| | |
|
|
|
| | Despite macroeconomic uncertainty, the Manhattan real estate market flourished in the first quarter. For only the fourth time in 20 years, all demand indicators (signed contracts, number of closings, median sale price) rose year over year. Although there was a slight dip in contracts in February, March saw a surge, as both buyers and sellers finally seem ready to transact.
Tellingly, the increases in new listings and contracts were not due to a new development pipeline, but were instead almost entirely driven by the resale market.
As for prices, for the first time since mortgage rates spiked in 2022, price metrics remained either level or higher for all product types (new development, resale condo and coop). |
| |
|
|
|
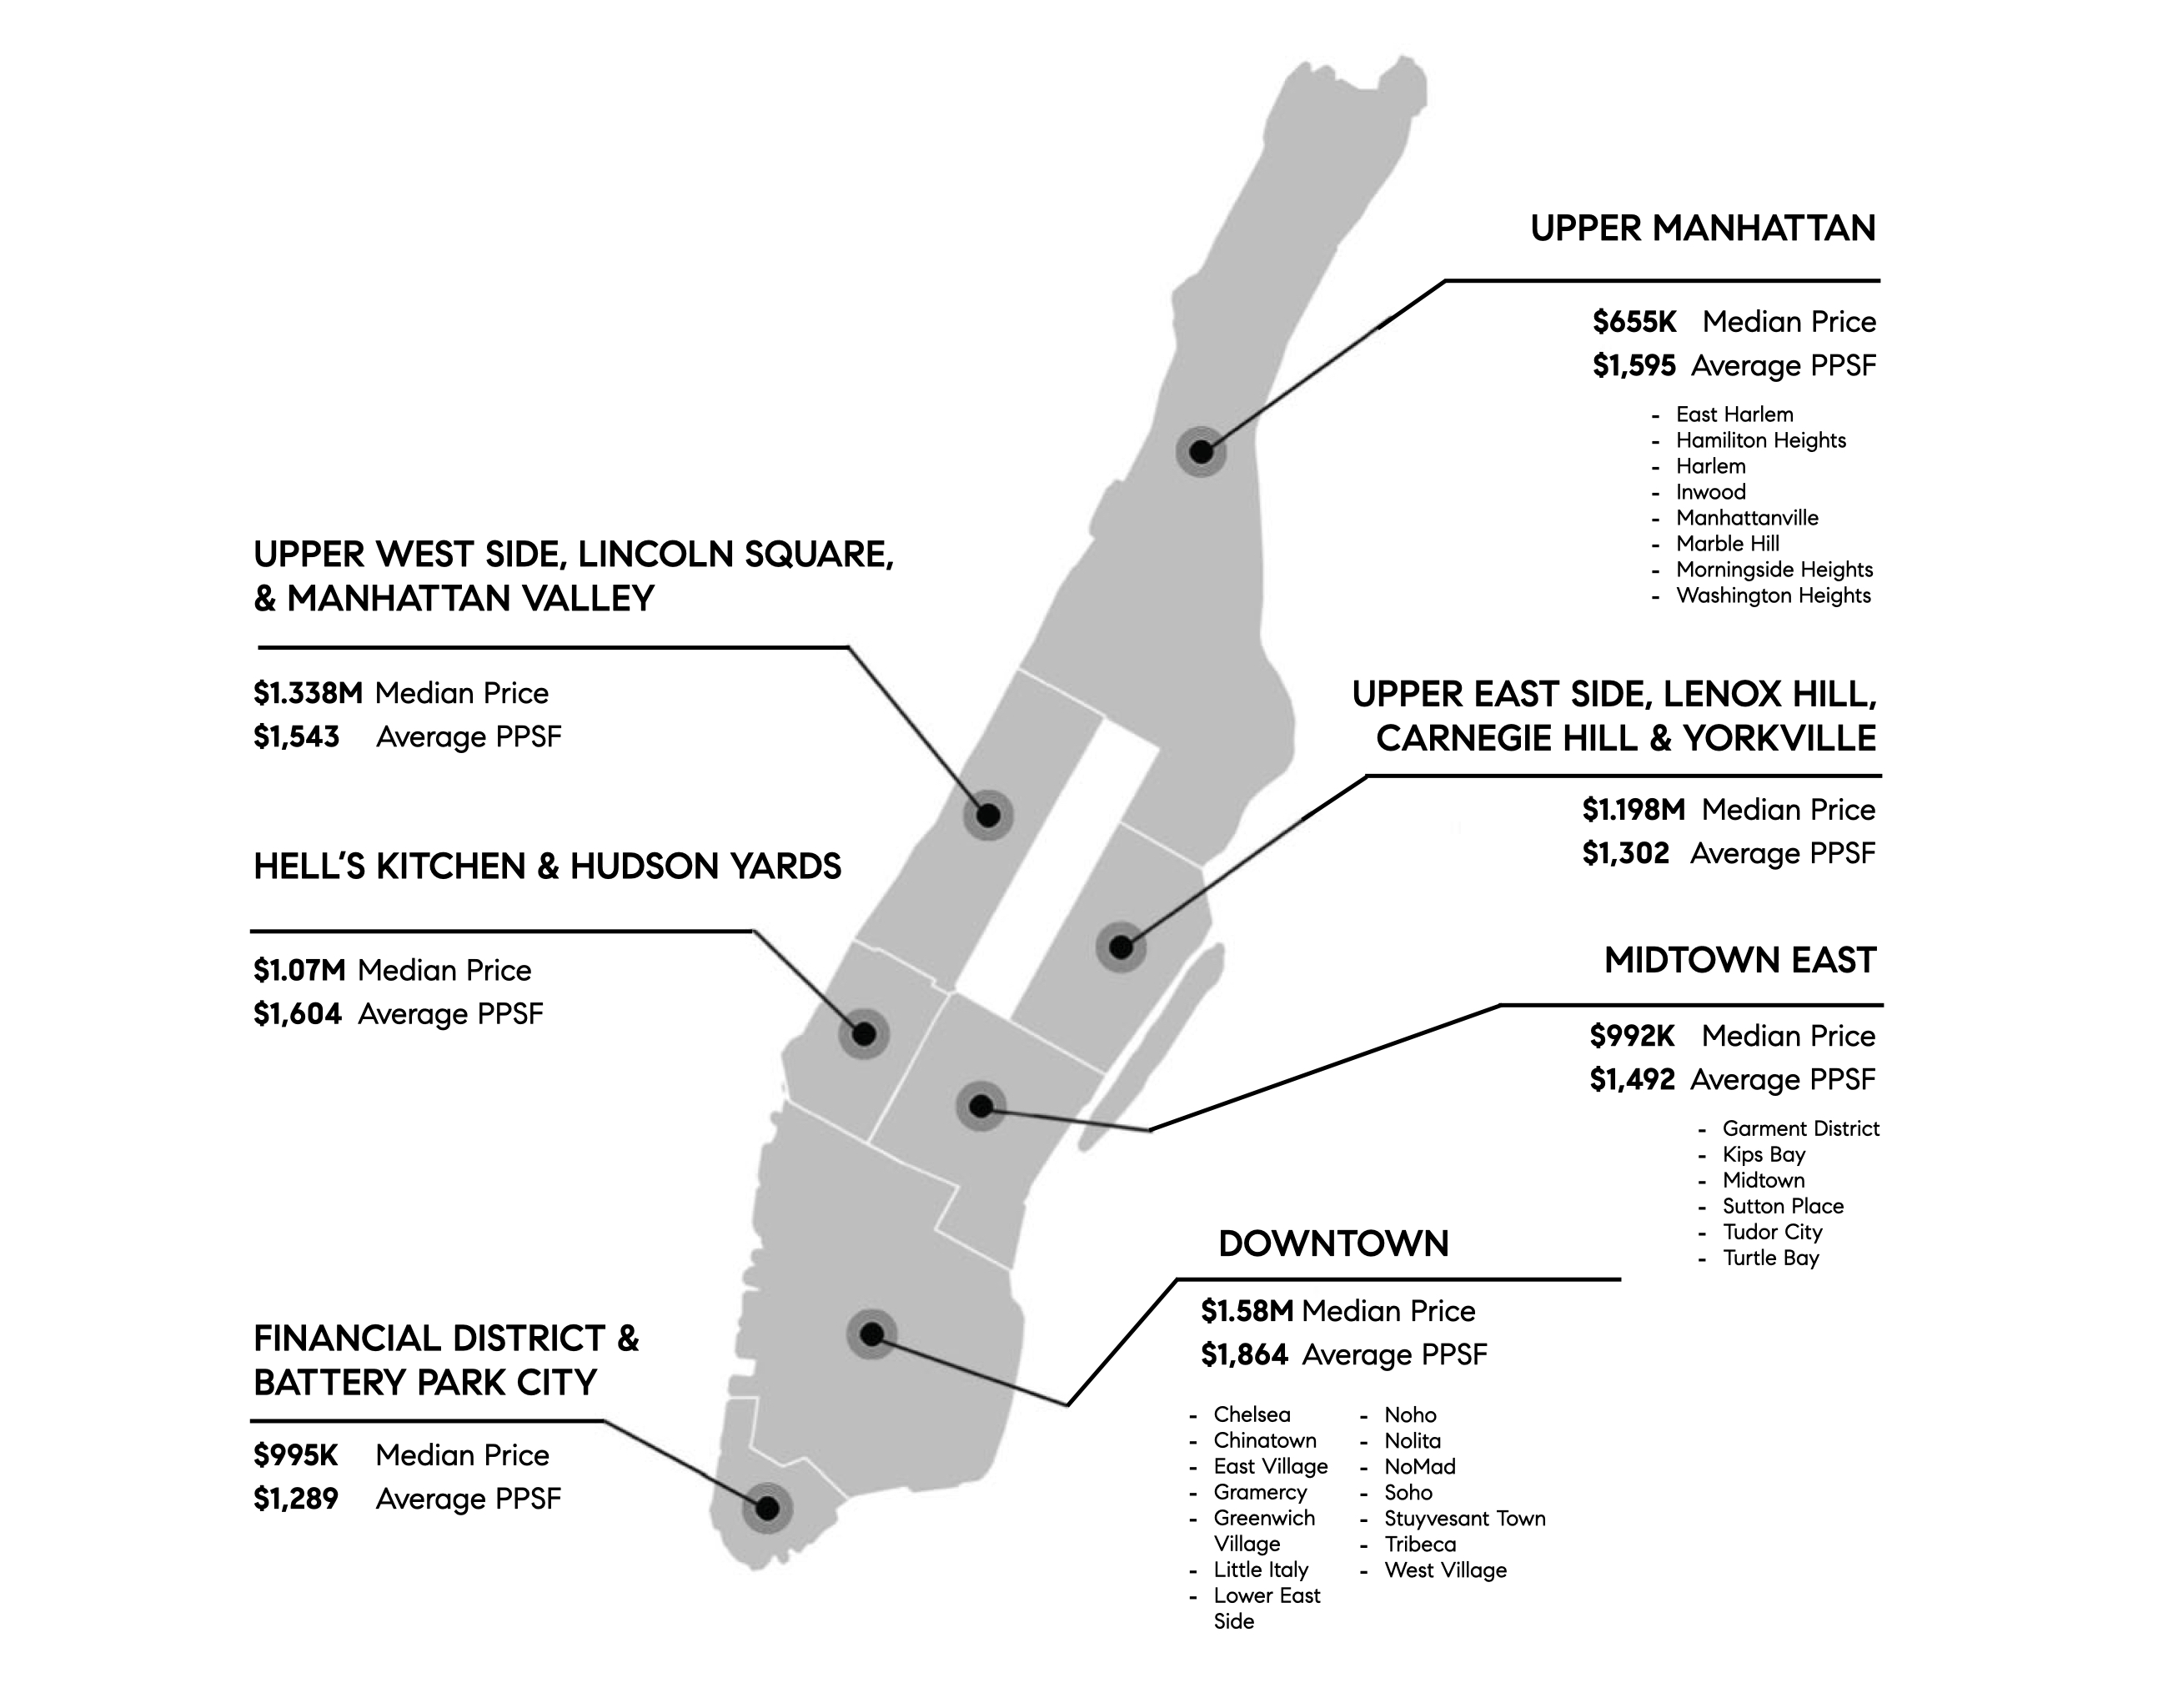
| Looking to the various Manhattan submarkets, a few notable trends have emerged:
The Upper West Side had the shortest time on market, as well as the highest year-over-year increase in median price per square foot of any other submarket. The Upper East Side saw a decline in inventory year-over-year, and saw an increase in prices, albeit more modestly than the Upper West Side. Downtown also saw increases in price per square foot, although more modest than what we saw on the Upper West Side. On the other end of the spectrum, Midtown had the longest time on the market, as well as the largest year-over-year decline in median price per square foot.
|
| |
|
|
|
|
Open house activity in Manhattan has generally mirrored the trends of 2024. While January started off with a bang, far surpassing 2024 figures, February saw a dip in traffic, hovering around 2 parties on average for most of the month and into March. By the end of March, traffic was slightly above last year's levels. For our own listings, inquiries and traffic have been stronger than last year, although buyers have been hesitant to make offers, especially on homes that need work or are priced aggressively. |
| |
|
|
|
| | | The Brooklyn market, which has consistently proven to be resilient even in the face of economic downturn, had a characteristically strong start to 2025, with an increase in signed contracts compared to last year. The combination of low supply and robust demand continued to push Brooklyn prices higher, with median prices reaching their second-highest level ever this quarter.
While overall inventory has slightly increased, new listings are still below historical averages, and resale inventory--particularly coops--is down substantially in almost all areas. Buyer demand in the borough remains high, although as we've come to expect the market is highly neighborhood-specific, with demand far outpacing supply in certain areas and for specific product types (i.e. resales and townhouses). Essentially all of our townhouse buyers have been involved in bidding wars this quarter across multiple neighborhoods and price points. |
|
|
|
|
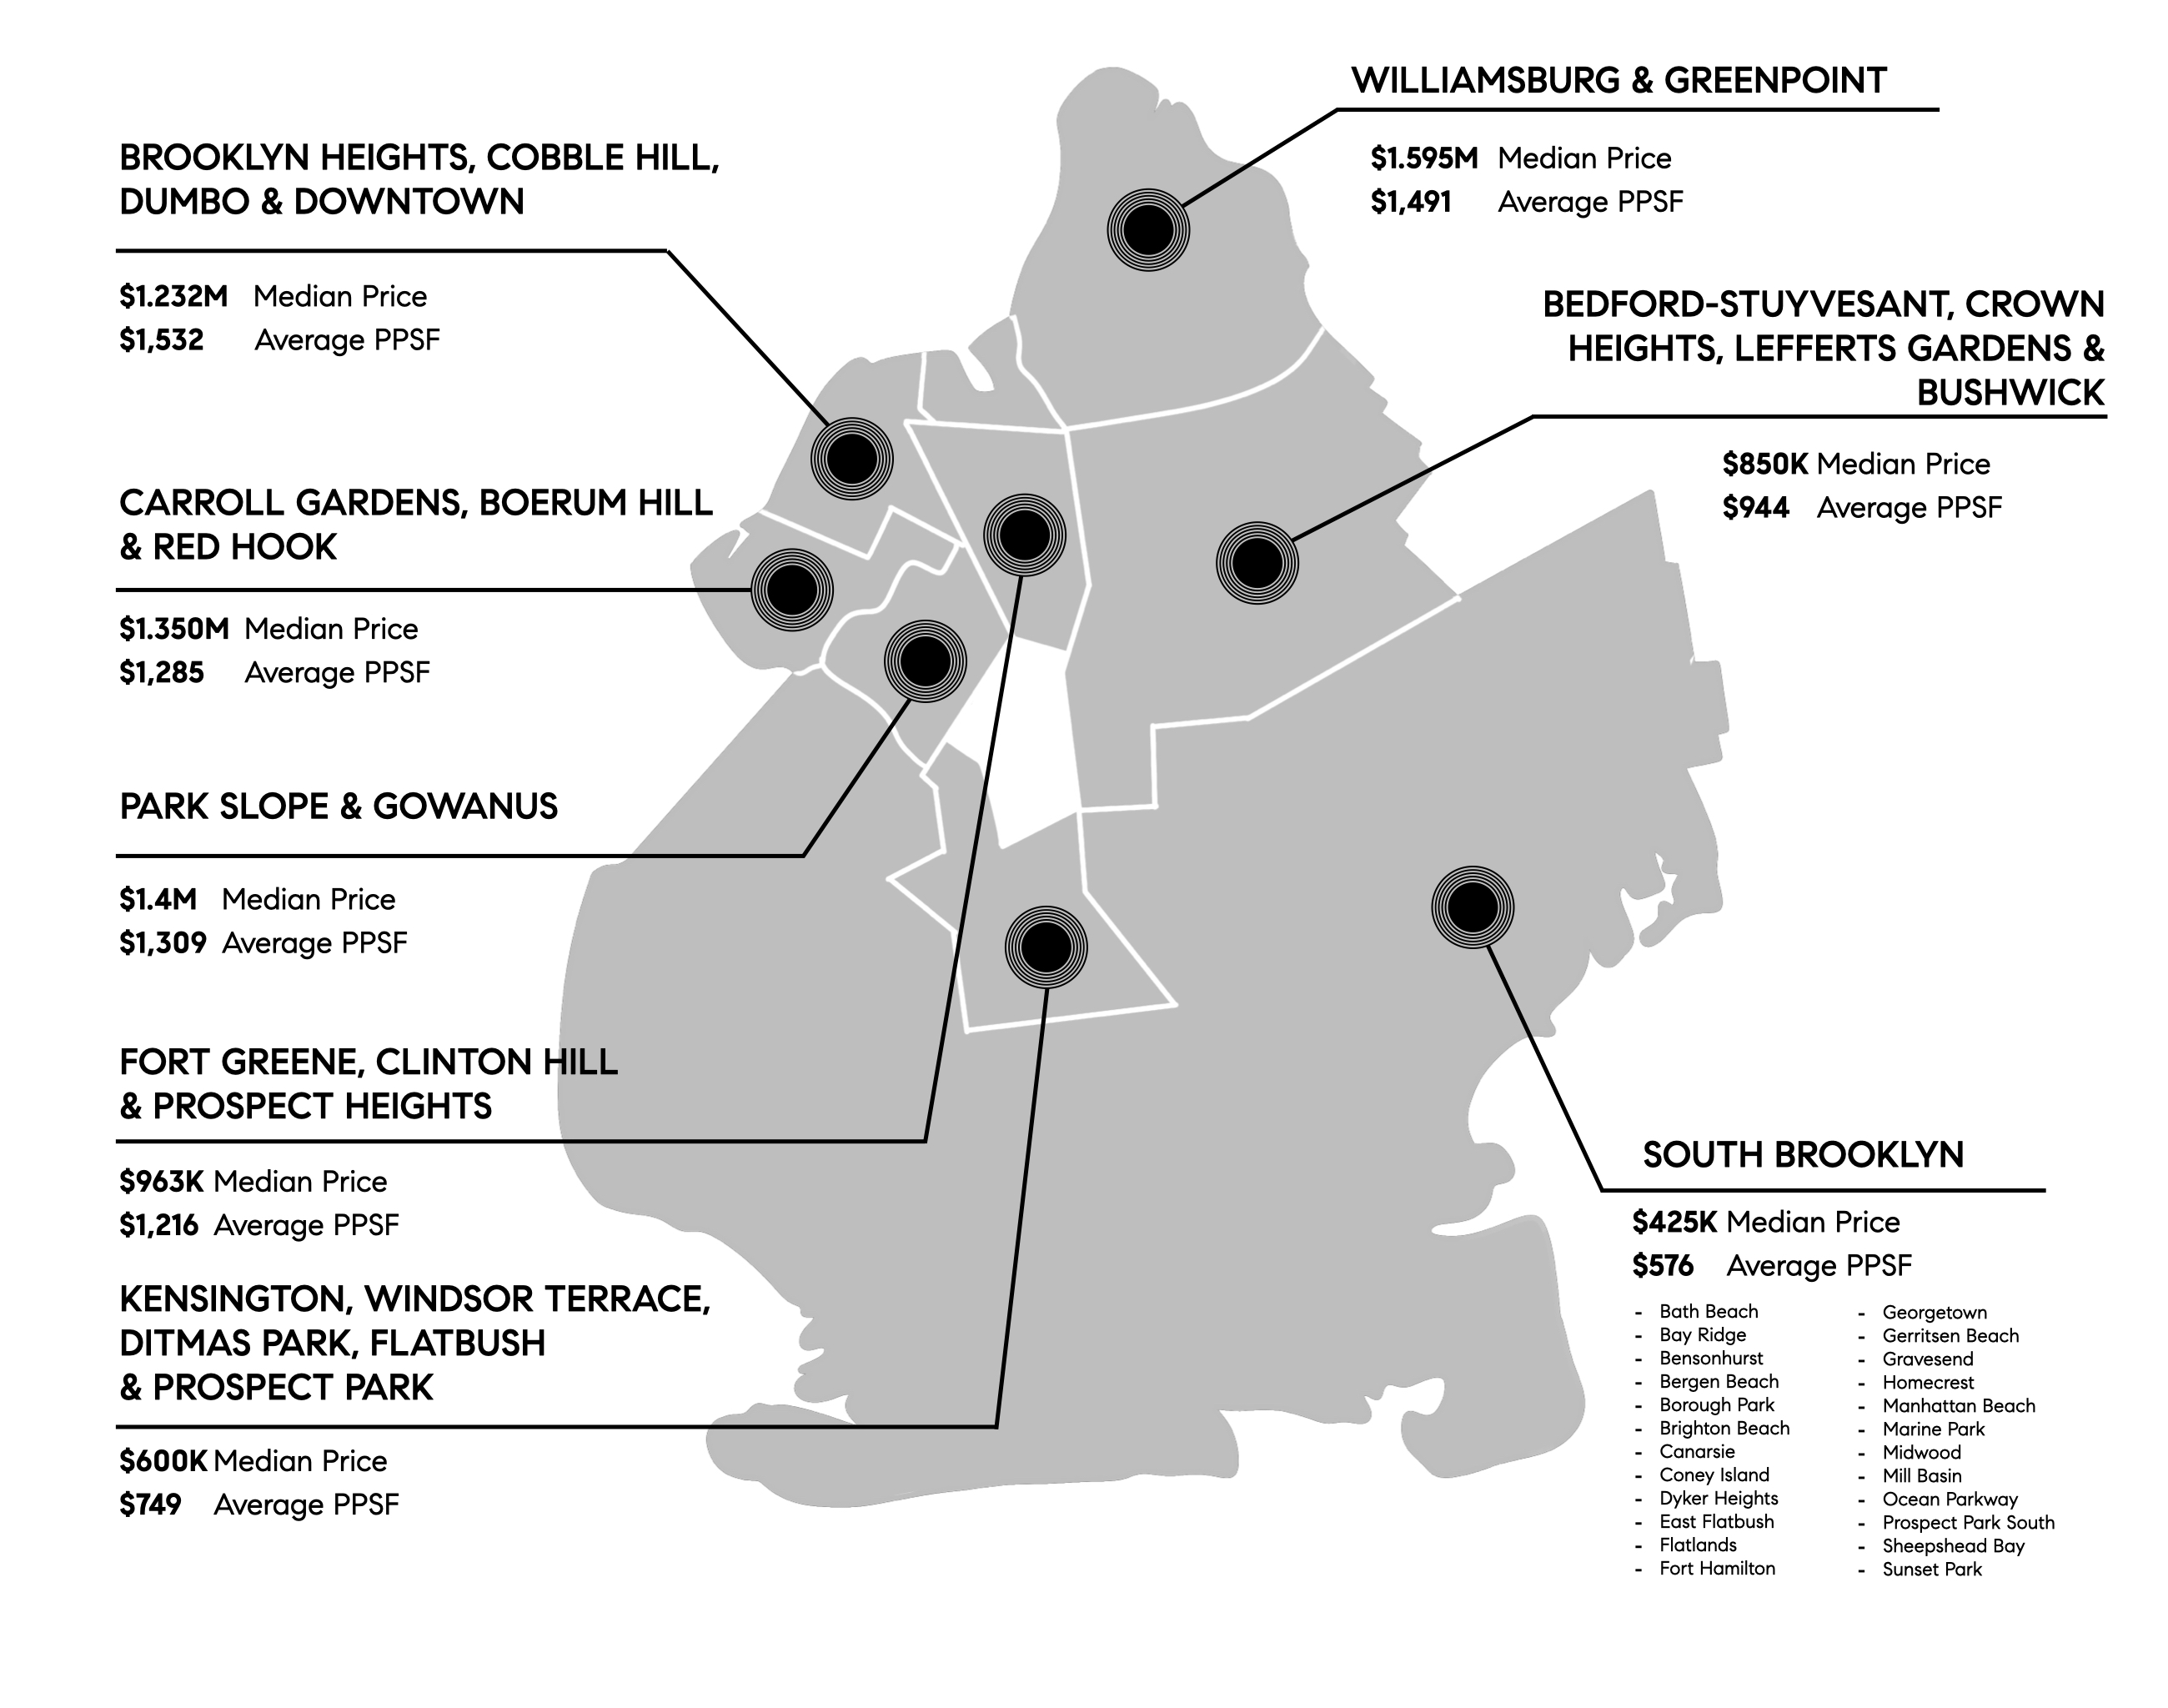
| | Looking closer at the various submarkets, here are some interesting trends:
Williamsburg and Greenpoint saw significant inventory and price growth, attributable to an influx in new development. Brooklyn Heights, BoCoCa, DUMBO and Downtown Brooklyn all saw a significant decline in new development closings, resulting in lower overall prices. However, demand in these areas has remained strong, and days on market dropped by double digits. Especially in BoCoCa, fierce bidding wars continue to be the norm. Park Slope & Gowanus saw the largest overall increases, both in prices and new inventory, largely attributed to substantial new development inventory entering the market and closing. In Northwest Brooklyn (all of "Brownstone Brooklyn") 27.5% more houses entered contract than last year, with a 14.5% higher median price.
|
| |
|
|
|
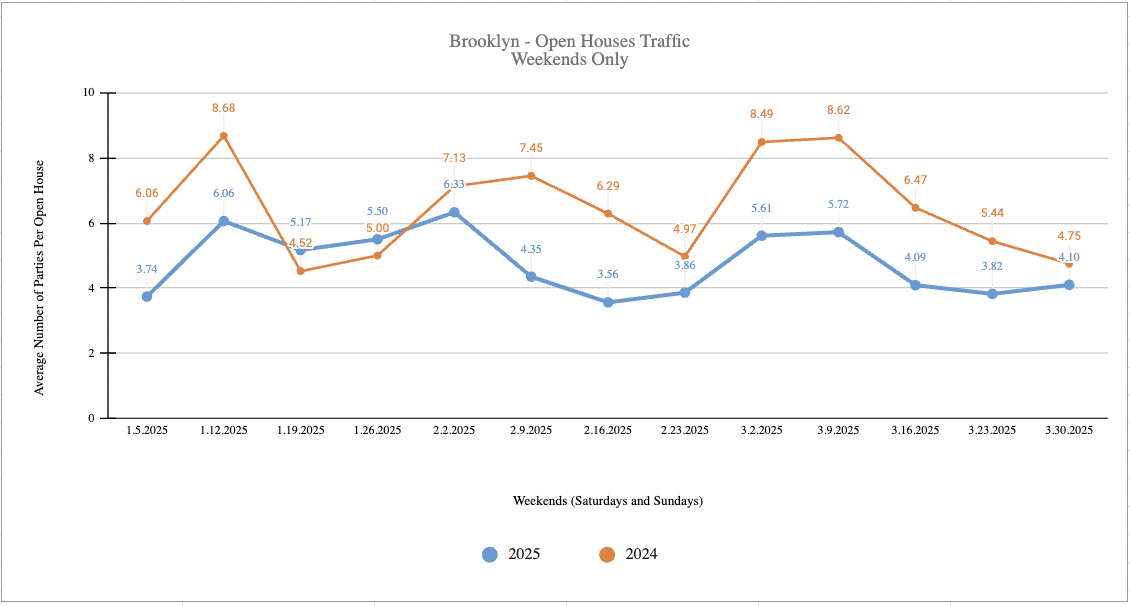
| Interestingly, according to Compass open house data, Brooklyn traffic has been consistently lower than 2024 figures for most of the quarter. This discrepancy may be attributed to a skewed data set due to recent changes in the report methodology, or possibly a shortage of standout new listings in recent months. In Brooklyn, although the overall numbers are higher compared to Manhattan, the averages are further distorted by one or two listings each week that attract large crowds, sometimes exceeding 40 visitors in a single day. |
| |
|
|
|
| | | At the last Fed Meeting in mid-March, as expected, the Federal Funds Rate was left unchanged for the second consecutive meeting, and rates have lately been hovering about 50 bps lower than at the start of the year. The Fed is now projecting two 25 basis-point rate cuts this year, two more in 2026, and another in 2027. Markets are anticipating that the first cut this year likely won’t be until June 18th, and the second not until sometime in the fall. However, uncertainty around tariffs makes this very hard to predict. In fact since the beginning of April, rates have been extremely volatile with rapid rises and falls of up to 50 bps. For those tracking, there have been good opportunities to float down their rates or refinance during the troughs. |
|
|
|
|
| | RATE DATA BASED ON BASED ON CITIBANK'S 30-YEAR FIXED-RATE FOR NON-CONFORMING LOANS, COURTESY OF ZACK TOLMIE, SR. LOAN OFFICER. |
| | | Manhattan’s high-end market just had its strongest Q1 in years, with $4M+ sales up nearly 30% and the average price soaring to a record $10.3M. Affluent buyers are making cash moves amid market volatility, while tight inventory and steady demand fuel a fast-heating luxury segment as spring approaches. (THEREALDEAL)
New York City just outpaced California and Florida in home price growth, with a 7.7% annual increase—the highest among major U.S. metros. Meanwhile, the national average rose just 4.1%. As the Spring season gets underway, we expect to see stronger demand and pressure on prices. (NY POST)
Manhattan rents hit a record $4,500 in February, with fierce competition driving bidding wars on over 25% of new leases. Brooklyn and Queens aren’t far behind, as demand surges amid limited supply and shifting lifestyles. (BLOOMBERG)
Landlords have until May 1 to install compliant natural gas detectors under Local Law 157. (LEARN MORE) |
| | | | Explore a collection of townhomes with private gardens and sunlit patios, offering a relaxed setting for spring living. |
| | | |
|
|
|
| | | | | | 2 BD 2 BA 0 SF $1,650,000 |
|
|
| | | | | 4 BD 5 BA 3600 SF $4,650,000 |
|
|
| | | | | 3 BD 3 BA 2275 SF $2,800,000 |
|
|
|
|
| | Hear it from our clients! |
|
|
|
|
| | | “Isil was a fantastic broker. She was an advisor and friend throughout the entire process. Isil first impressed me because of her genuine interest in and ability to discuss the real estate market and trends in different neighborhoods, and she kept impressing me with her attention to detail, consistent follow-up and availability to move the process diligently along.” – Katie, repeat client (buyer & seller) in Upper Manhattan |
|
|
|
|
| | Office: 646-982-0353 Compass is a licensed real estate broker. All material is intended for informational purposes only and is compiled from sources deemed reliable but is subject to errors, omissions, changes in price, condition, sale, or withdrawal without notice. No statement is made as to the accuracy of any description or measurements (including square footage). This is not intended to solicit property already listed. No financial or legal advice provided. Equal Housing Opportunity. All Coming Soon listings in NYC are simultaneously syndicated to the REBNY RLS. Photos may be virtually staged or digitally enhanced and may not reflect actual property conditions. |
|
|
|
|
|
|