| | 2026 got off to a sluggish start, as new listings were slow to come to market amid recurring snowstorms and prolonged cold weather. Demand, however, remained strong, particularly in key neighborhoods, with days on market down and prices up in most sectors. As new listings picked up in March, contract activity increased meaningfully, and recent momentum suggests inventory relief may be on the horizon this Spring. Buyers are ready, and the market is waiting for supply to follow.
Read our full Manhattan and Brooklyn analysis below, and reach out anytime to discuss what it means for you. We’re also a resource beyond Manhattan and Brooklyn, whether it’s connecting you with trusted agents in other markets or helping with anything real estate-related along the way. |
| | |
|
|
|
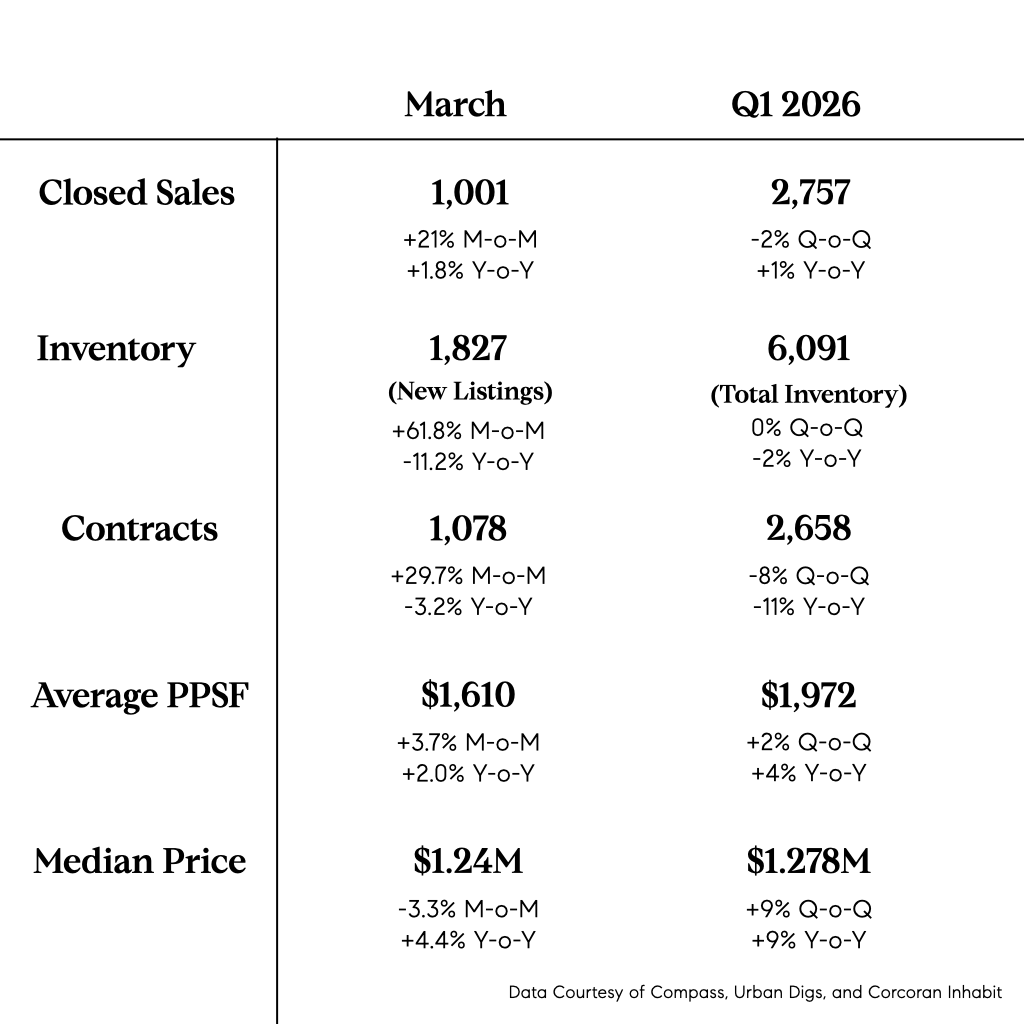
| An unusually cold and stormy winter led to a slower start to 2026. Though indicators continued to point to strong buyer demand, a lack of new listings constrained activity. While total inventory was only down 2% year-over-year, new listings declined by double digits, and new development listings were nearly 75% below 10-year historical averages.
Fewer new listings translated to fewer contracts, despite clear demand reflected in faster deal pace and higher prices. Days on market fell 9% year-over-year, marking the quickest first-quarter contract pace since 2018. Prices increased across all property types except one-bedrooms, with the strongest gains in two-bedroom and larger homes. There was a notable jump in signed contracts from February to March. While the typical increase between these two months tends to be in the teens, this year's ~ 30% surge stands out. |
| |
|
|
|
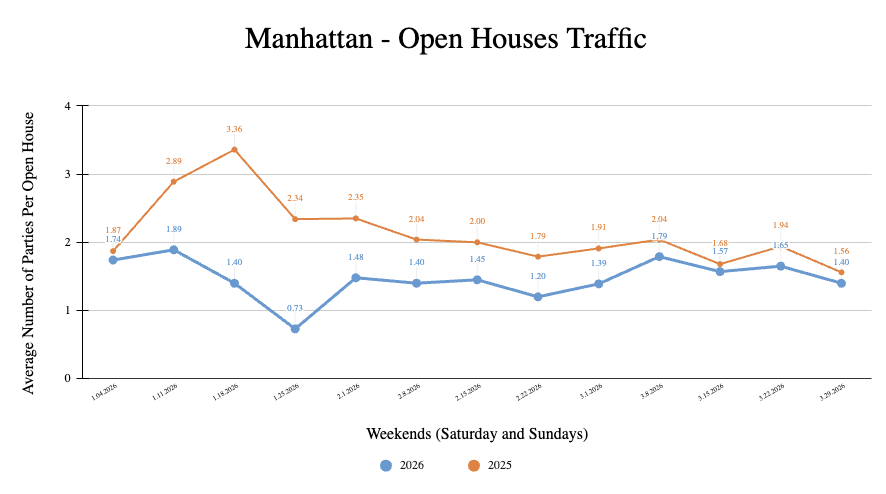
| Open house traffic remained below 2025 levels throughout Q1 2026, with the biggest declines in January and early February following major snowstorms. Activity in March was roughly in line with last year, though the final weekend dipped due to the Passover and Easter holidays. |
|
|
|
|
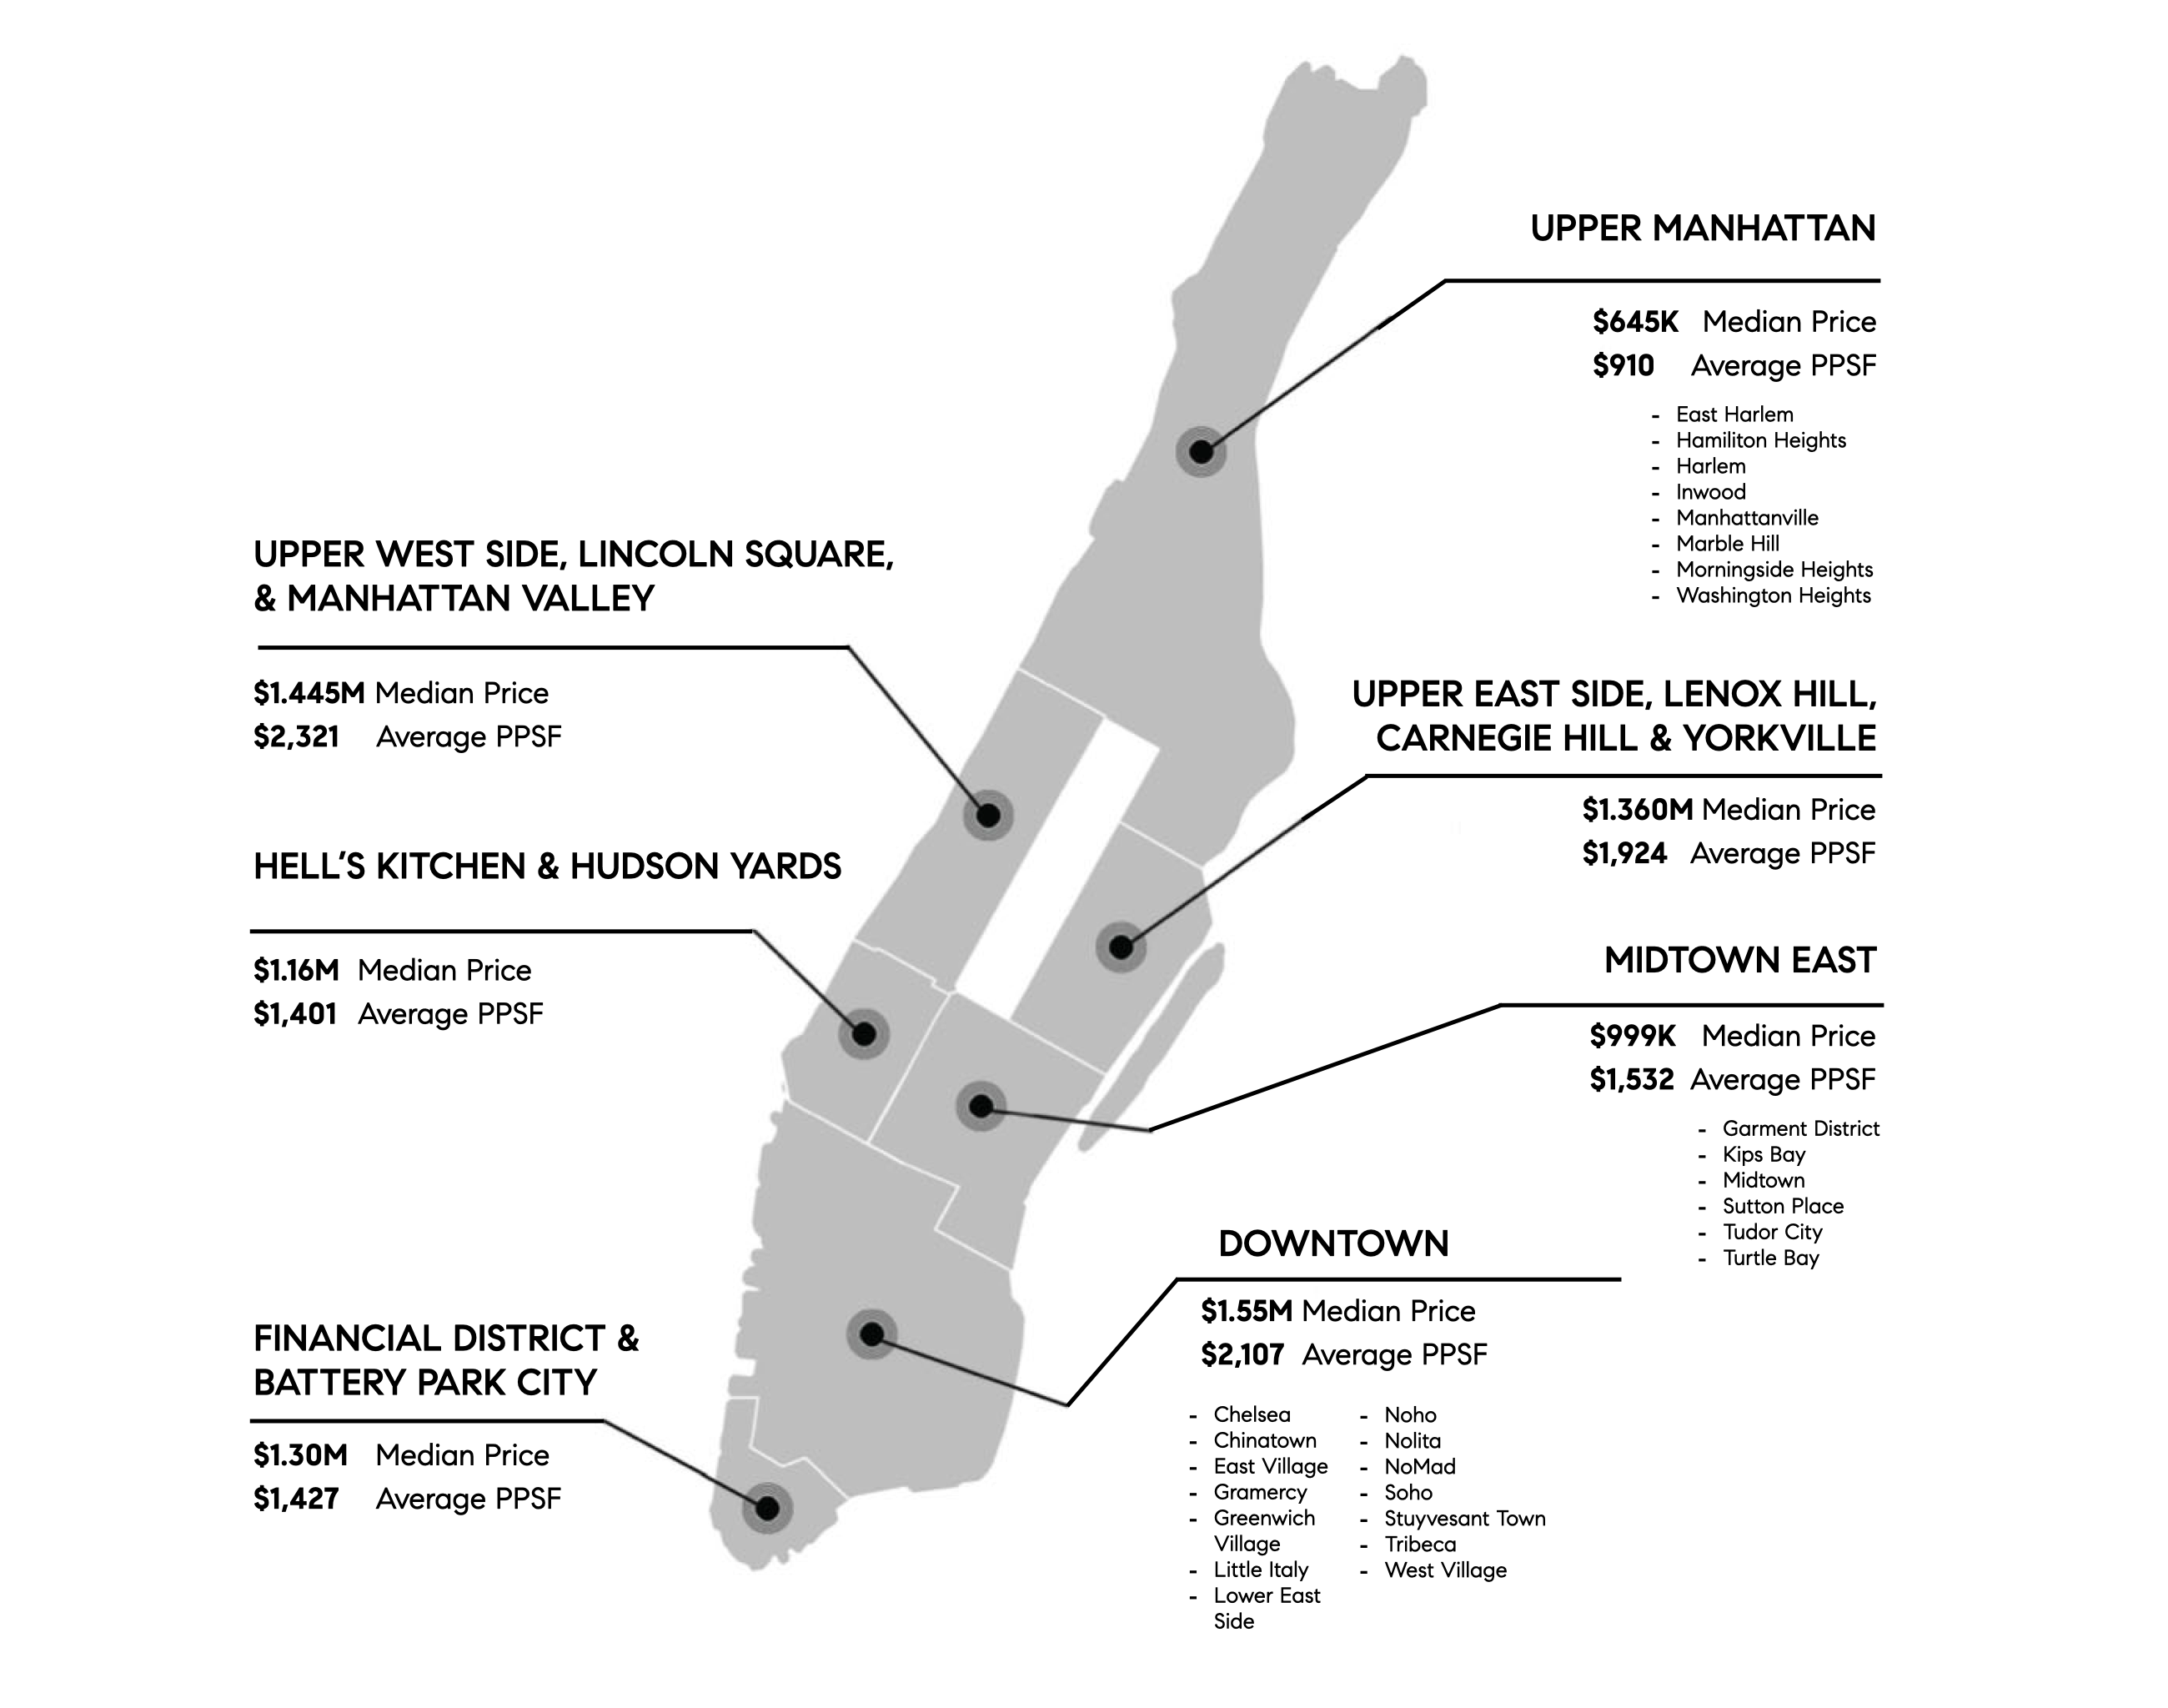
| | As for neighborhood trends, total inventory was down in the Upper East Side, Upper West Side, and Downtown, while supply increased in Midtown, FiDi, and Upper Manhattan. Downtown saw the largest drop in both market share and number of closings. Median sale prices rose across Manhattan (except in Upper Manhattan), with particularly strong gains for two-bedroom and larger homes on the Upper East Side. Anecdotally, our Upper East and Upper West Side buyers struggled with limited new supply, and well-priced properties moved quickly. Days on market averaged 101 days in both the Upper East and Upper West Sides, representing a 15% and 6% year-over-year drop, respectively. |
| | In the last week, we have finally seen some relief in inventory with an uptick in new listings following the Easter/Passover holidays. We are optimistic that new listings will mean a busy and strong Spring market. |
| |
|
|
|
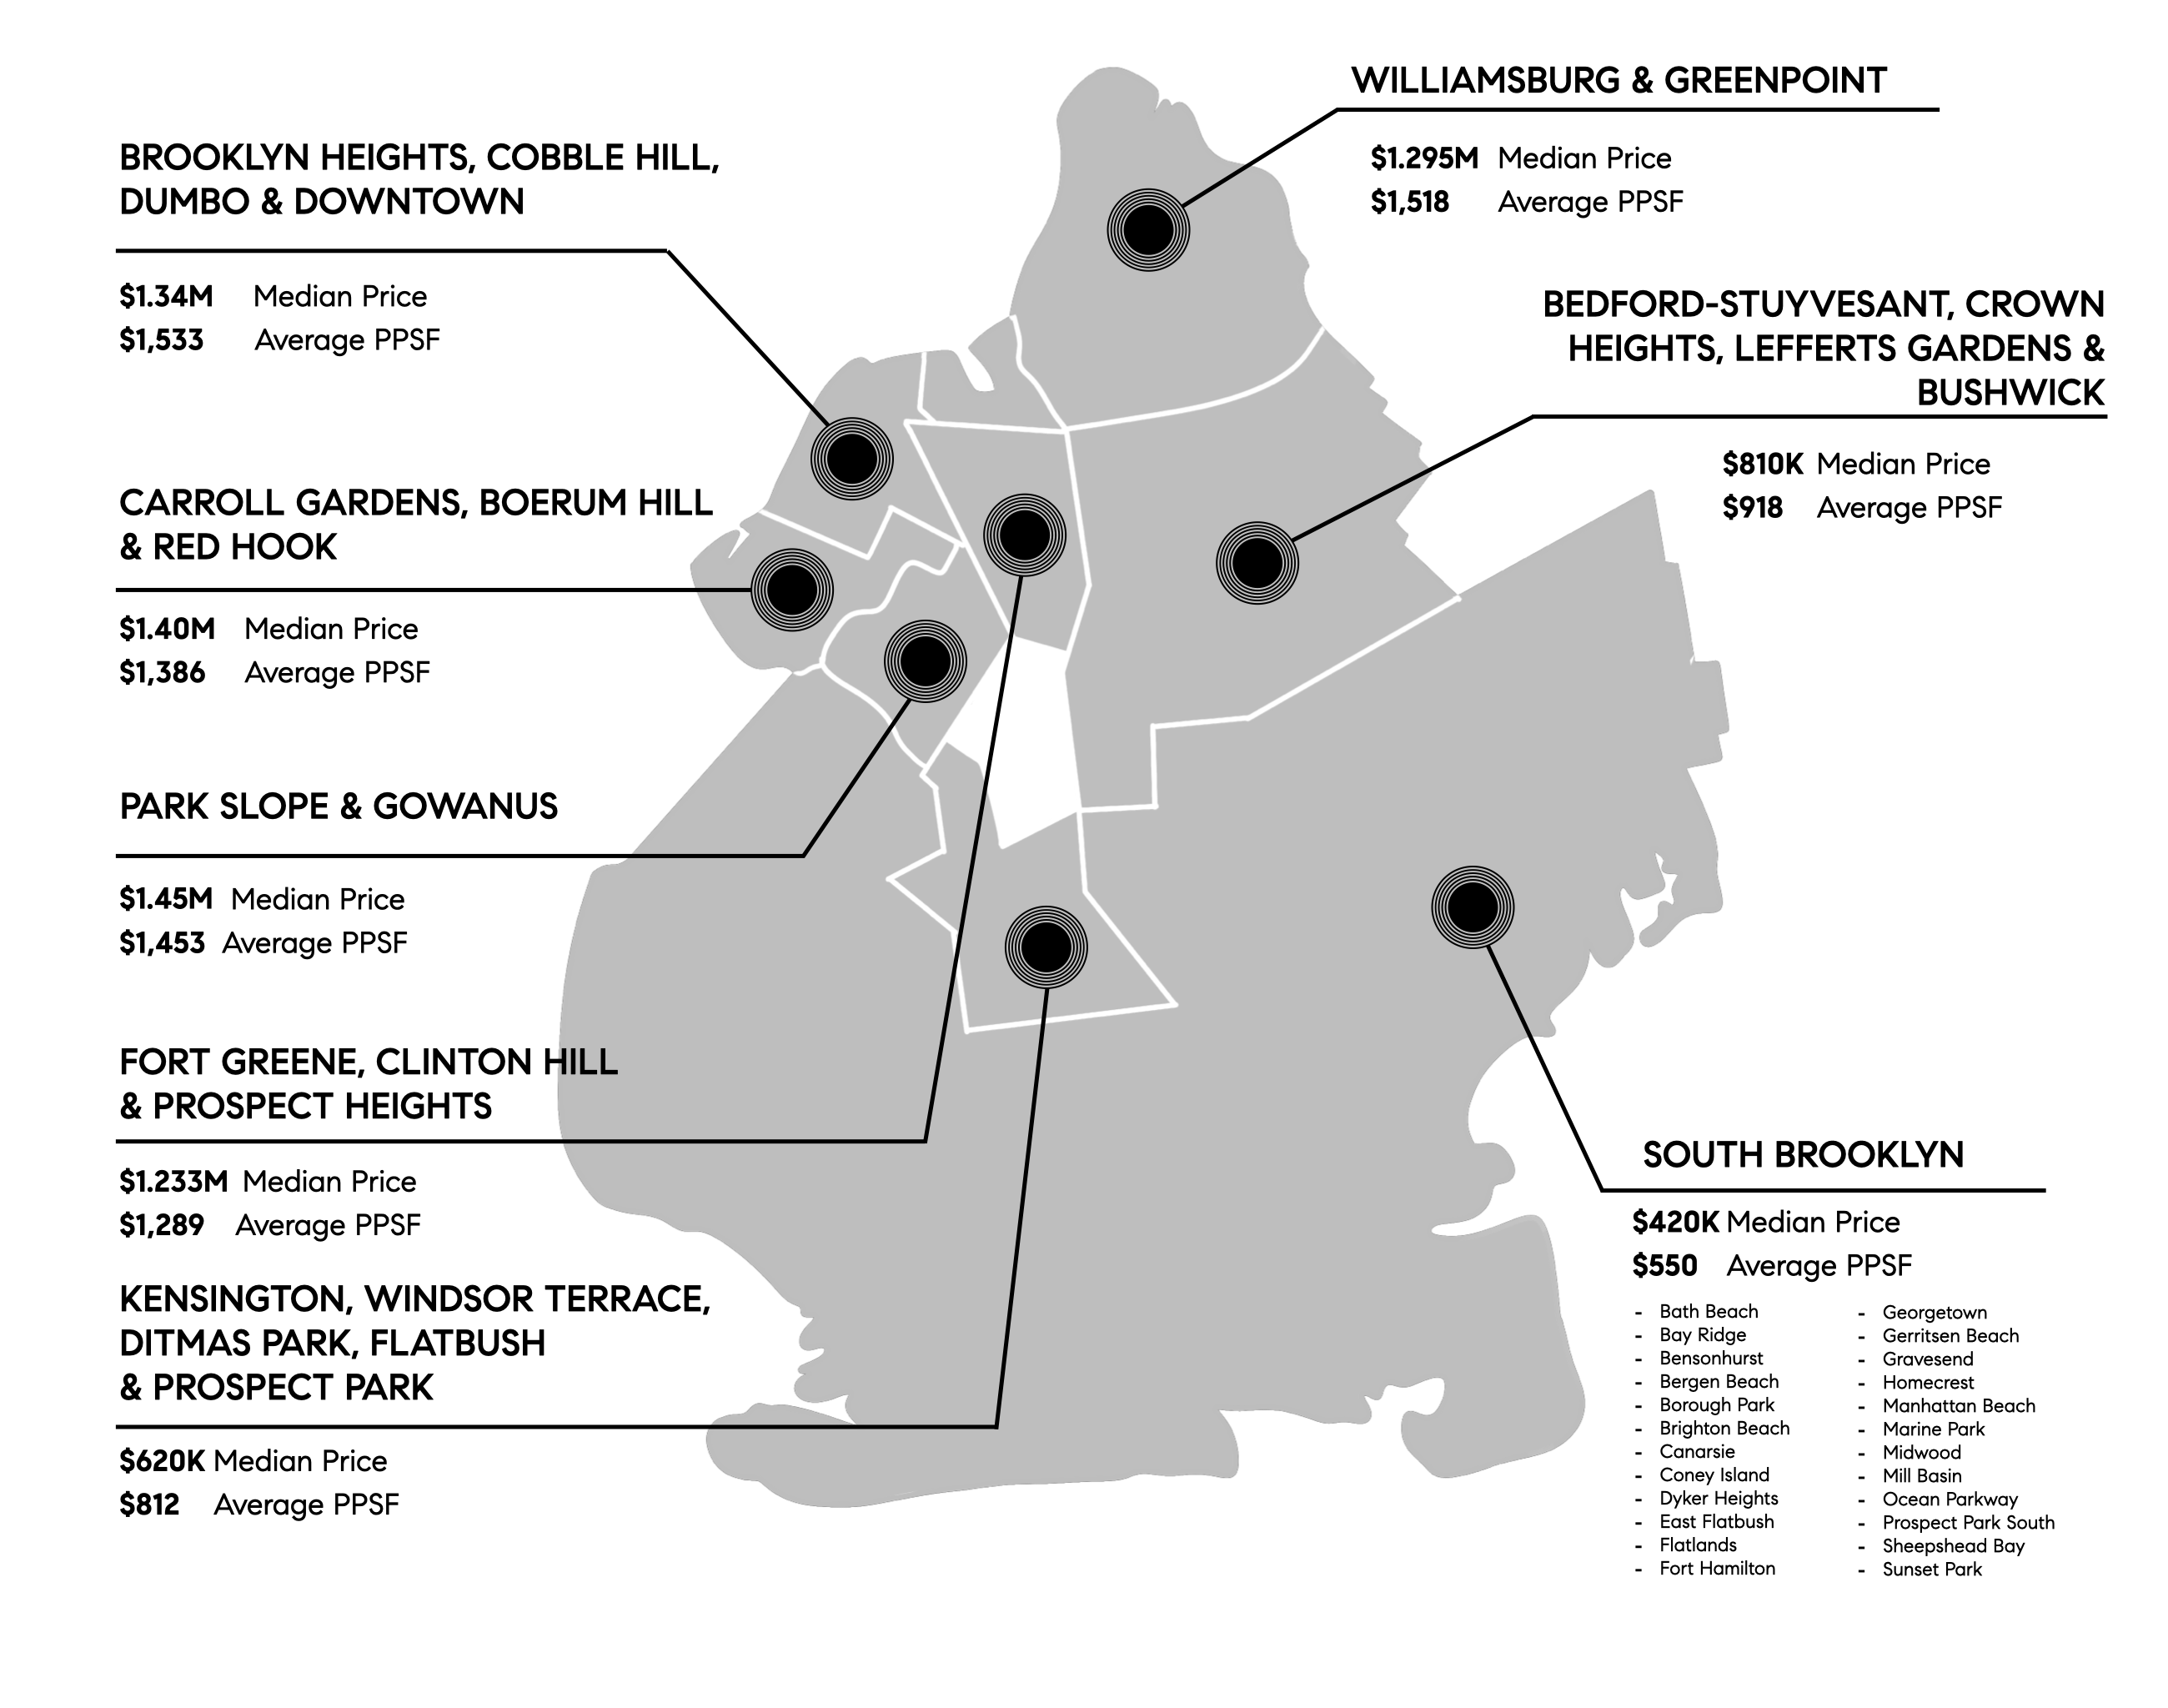
| Brooklyn followed a similar pattern. Limited inventory in the most in-demand areas led to fewer contracts and closings, even as pricing remained strong. Closed sale prices stayed elevated, supported by a higher share of high-end transactions. Resale condo and new development prices posted double-digit gains, driven by increased $2M+ activity.
While overall inventory rose, this was largely due to a 30% increase in listings under $500,000, with a surge of coop and condo supply in South Brooklyn. In contrast, inventory of three-bedroom and larger homes declined across the borough, with Park Slope and Gowanus seeing the most significant year-over-year drop of any submarket (-20%), and Boerum Hill & Carroll Gardens close behind with a 19% decline compared to Q1 of last year. |
|
|
|
|
| | As in Manhattan, open house traffic in January and February was notably slower than last year, likely due to weather and limited new listings. Activity picked up meaningfully by the end of March, with the final two weekends surpassing 2025 levels. |
|
|
|
|
| | Closings declined borough-wide, with the exception of Brooklyn Heights, Cobble Hill, DUMBO, and Downtown Brooklyn, where elevated new development activity drove higher averages. Median sale prices were flat to up across most submarkets, with the exception of South Brooklyn, which saw a modest 3% decline, and Williamsburg and Greenpoint, where prices dropped double digits due to a lower share of new development closings compared to this time last year. |
| |
|
|
|
| | | Rates briefly touched a three-year low in February before reversing sharply in March, driven largely by geopolitical tensions with Iran. As energy prices spiked, inflation expectations and Treasury yields moved higher, pushing mortgage rates back into the low-6% range.
Since then, volatility has persisted, but rates have generally stabilized around the low-6% range. Looking ahead, much will depend on energy markets and inflation trends, both of which continue to be influenced by ongoing geopolitical risks. If oil prices remain elevated, rates are likely to stay higher for longer; if tensions ease, there may be some downward pressure. |
|
|
|
|
| | RATE DATA BASED ON BASED ON CITIBANK'S 30-YEAR FIXED-RATE FOR NON-CONFORMING LOANS, COURTESY OF ZACK TOLMIE, SR. LOAN OFFICER. |
| | | Rental listings across New York City fell about 6% in February compared to last year, continuing a two‑year stretch of shrinking inventory, while the median asking rent jumped over 8% to around $3,950. The decline comes as the city debates housing policies like the broker‑fee ban, but the bigger issue is still a shortage of available apartments. (THEREALDEAL)
Manhattan’s luxury market is holding firm heading into the spring, with high-end sales continuing to show strength. Recent data points to steady contract activity at the $4M+ level, driven largely by well-capitalized buyers who remain active despite broader economic uncertainty. (CRAINS)
With Wall Street bonuses the highest they’ve been in 3 decades, totaling nearly $50B, the NYC luxury real estate market is bracing for a strong year and beyond. Since this compensation is often delayed, the boom could feed the market for years and may have an even bigger impact in the Hamptons. (THEREALDEAL)
New development activity across New York City is increasingly split. In Q1 2026, 56 contracts were signed for new development condos asking $10M+ - up nearly 90% year-over-year - while overall new development contract activity across Manhattan, Brooklyn, and Queens fell about 15%. (THEREALDEAL)
|
| | | Now that we’re past one of the harshest winters in a while, here’s a curated collection of homes to ring in spring, featuring private outdoor spaces with stunning views.
|
| | |
|
|
|
| | | | | | | | “We had a wonderful experience working with Isil. She is very knowledgeable and always accessible to her client. She kept us informed throughout the whole process. We have done a few real estate transactions and worked with a number of real estate agents. Isil is by far one the best agents we have ever worked with. We are looking forward to working with her in our next real estate endeavor. Thanks Isil!”
- Seller of a Morningside Heights Condop |
|
|
|
|
| | Office: 646-982-0353 Compass is a licensed real estate broker. All material is intended for informational purposes only and is compiled from sources deemed reliable but is subject to errors, omissions, changes in price, condition, sale, or withdrawal without notice. No statement is made as to the accuracy of any description or measurements (including square footage). This is not intended to solicit property already listed. No financial or legal advice provided. Equal Housing Opportunity. All Coming Soon listings in NYC are simultaneously syndicated to the REBNY RLS. Photos may be virtually staged or digitally enhanced and may not reflect actual property conditions. |
|
|
|
|
|
|