| | I am pleased to share with you our Q2 Market reports for Manhattan and Brooklyn. The Spring market was interesting in that we saw a reversal of fortunes between the two boroughs. While Manhattan seemed to finally wake up from its slump (almost all indicators of activity were up as were prices), things seemed to cool in Brooklyn with transactions and prices down compared to last year. To be clear, the most popular areas of Brooklyn continued to surpass demand in Manhattan, and it is still more common in these areas to see bidding wars and properties trading much above ask, but we also saw negotiability and/or price reductions for properties where properties (even in these in-demand areas) were not priced right or positioned well.
Right now, we are largely busy moving our deals from contract to closing and starting to prep our listings for the Fall. The importance of maximizing the appeal of properties through things like a clean paint job, minor repairs, and selective or full-scale staging cannot be overstated. Even the most analytical or imaginative buyers will have an immediate gut reaction to a property, and this impression will stay with them from the initial stages of deciding whether to make an offer, through negotiations, and shading the experience to closing.
Please don't hesitate if you have any questions about the real estate landscape in NYC or elsewhere. Even if it's outside our area of expertise, we can always connect you with the best resource. |
| | |
|
|
|
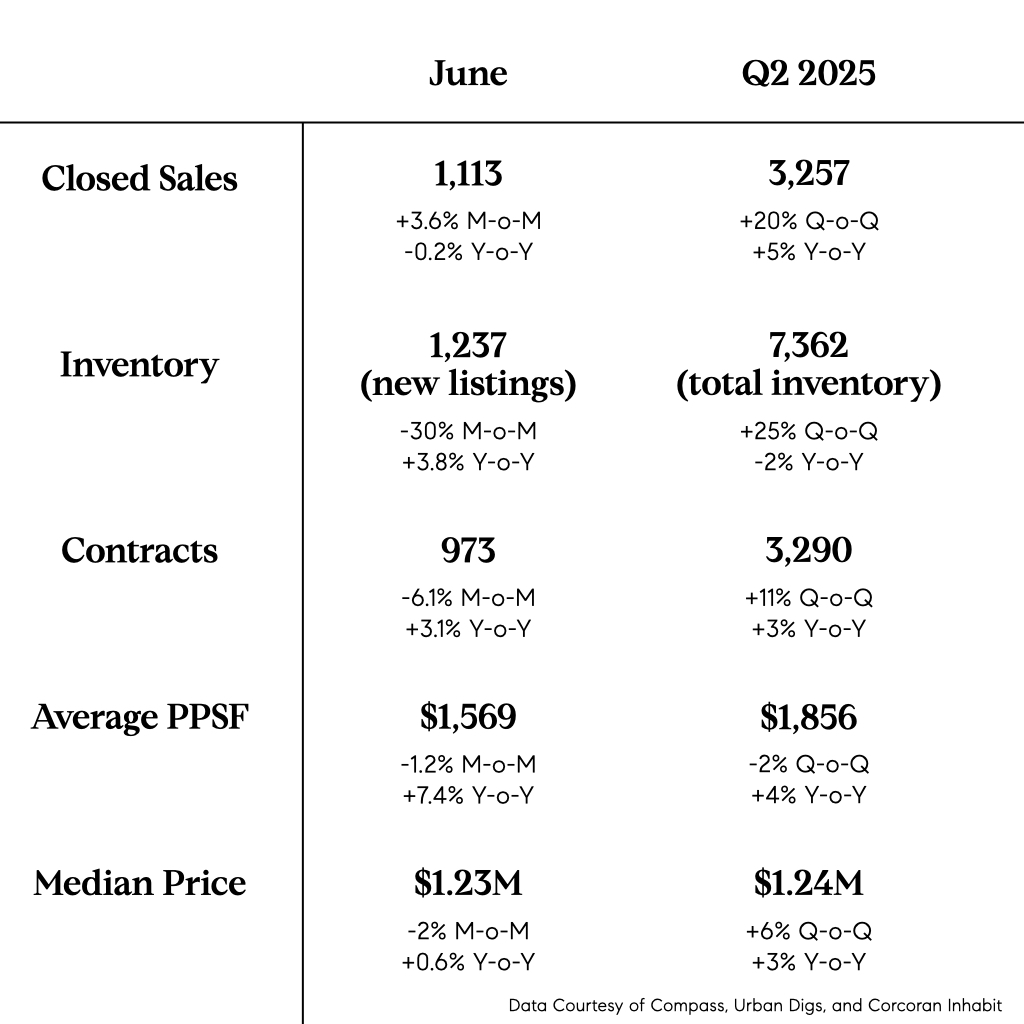
| Despite ongoing macroeconomic volatility, the Manhattan real estate market remained robust in Q2, reaching a three-year high in total sales. Although supply decreased, both contracts and prices rose across almost all submarkets compared to the same time last year. While the end of Q2 saw recent developments that could shift the market for the remainder of the year (tariffs, the NYC mayoral election, etc.), we are hopeful that after a strong start to the first half of the year, we are set up for continued momentum heading into Fall. |
| |
|
|
|
| All market indicators were up this year versus last. Signed contracts were up and the total number of sales rose to a 3-year high. Strong contract activity (and fewer new development listings) contributed a decline in total inventory. Median sale prices and price per square foot increased due to heightened demand as well as strong closings in the new development and luxury market. |
|
|
|
|
| | Contrary to what one might expect based on the data, other than a single weekend in June, Manhattan open house traffic in Q2 has reliably trended below the same time period last year. This may be due simply to data collection as Compass's methodology for collecting this information changed this year leading to higher survey participation rates and a massively larger data set. It could also be that there has been a shift toward more private appointments and more serious buyers who are ready to transact. |
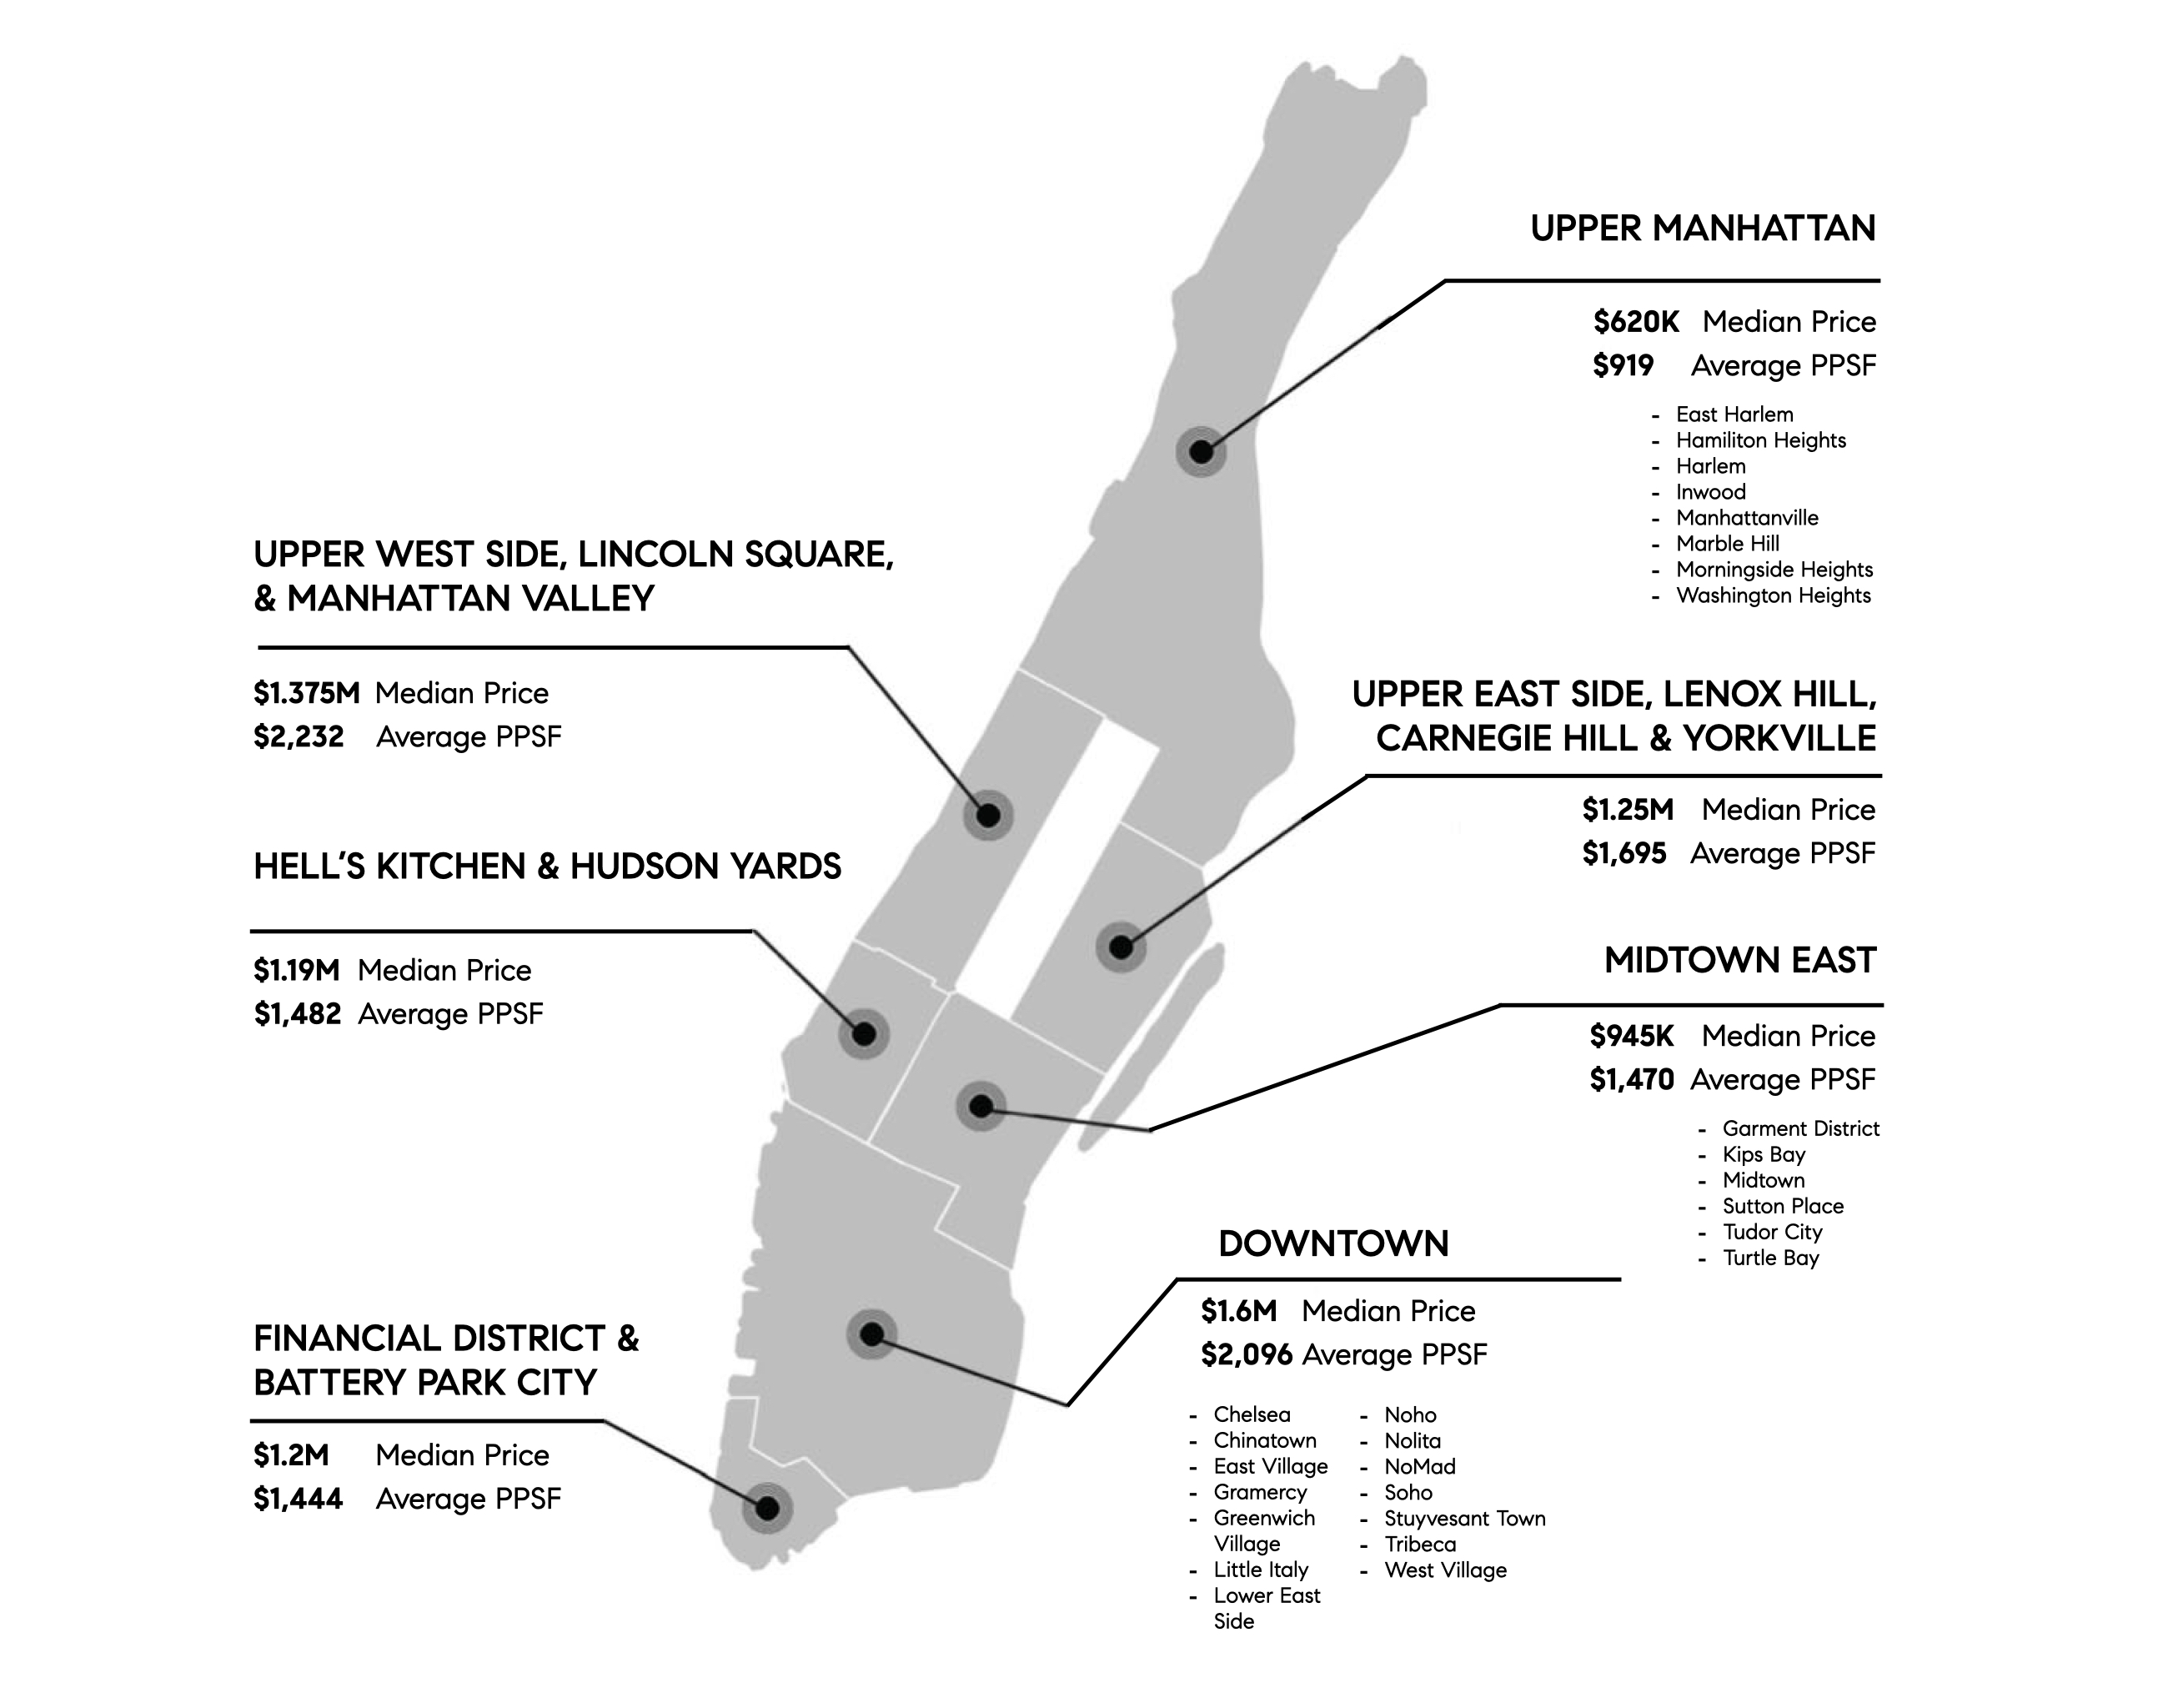
| | Looking more closely at the various parts of Manhattan, some notable trends:
The most marked decline in inventory was centered on the Upper East and West Sides – all other submarkets either remained even or saw inventory growth. Downtown performed the strongest in terms of median sale and price per square foot growth. The Upper East Side also had a big jump in price per square foot though a slight downtick in median price likely driven by increased demand in the lower price points which had been dampened by high interest rates. Upper Manhattan saw a year-over-year decline in average sale price per square foot due to new development sales which were fewer and at a lower average price per square foot. Midtown East saw a double-digit increase in prices driven almost entirely by new development closings.
|
| |
|
|
|
| Unlike what we saw in Manhattan, the Brooklyn market slowed, diverging from its usual pattern of resilience and unwavering growth. While demand remained strong in some sectors, signed contracts and closed sales were down markedly. While some of this can be attributed to lower inventory, price sensitivity is a major factor, especially those looking to purchase on the lower (<$1M) end of the market, which also saw the greatest dip in inventory. On the ground we’ve felt that proper pricing has become more important than ever. While there are still bidding wars on conservatively priced properties, we have seen negotiability and price reductions on aggressive asking prices, even in the most in-demand neighborhoods. |
|
|
|
|
| | Almost all price metrics ticked down slightly from this time last year, with only median price per square foot remained unchanged. Interestingly, resale condo and coop median sale prices actually increased year-over-year, but a sharp decline in new development closings (down 40%) -- typically sold at higher prices than resales -- caused the overall median sale price and price per square foot to decrease. Average price per square foot also fell 5% from a year ago, although the significance of this dip should be tempered by the fact that last year’s figure was the highest on record. |
|
|
|
|
| | As we've come to expect, Brooklyn open house traffic trended significantly higher than Manhattan, but it was below last year's numbers. While some properties continued to draw massive crowds, a packed open house is no longer a foregone conclusion even in the most in-demand neighborhoods. |
| | Looking more closely at the various submarkets, there was some relief from inventory constraints. Park Slope, Prospect Heights, Williamsburg, and Greenpoint saw an increase in total inventory, and Brooklyn Heights and BoCoCa finally welcomed a rise in resale inventory which had been sharply limited. Median sale prices declined in Cobble Hill, Brooklyn Heights, DUMBO and Downtown Brooklyn, but this was attributable to far fewer new development closings in Q2. On the flip side, Park Slope, Gowanus, Carroll Gardens and Boerum Hill all saw an increase in new development closings (and a significant uptick in closings overall) as well as median sale price growth. |
|
|
|
|
| | | While the first quarter of 2025 saw mortgage rates steadily fall as concerns of inflation waned, the second quarter was more volatile as markets reacted to concerns over tariffs. The 10-Year Treasury Yield and mortgage rates plunged at the beginning of March as a knee jerk reaction to the tariff announcements, but we lost about half the mortgage rate improvements in the first six weeks of the second quarter. The following six weeks saw a bit of a return of those improvements, but the trajectory is far from certain with tariffs still in limbo, inflation up, and with looming threats on Powell continuing in his current post. |
|
|
|
|
| | RATE DATA BASED ON BASED ON CITIBANK'S 30-YEAR FIXED-RATE FOR NON-CONFORMING LOANS, COURTESY OF ZACK TOLMIE, SR. LOAN OFFICER. |
| | | Manhattan sales rose 16.6% year-over-year to a two-year high, with the median price increasing 1.6% to $1.2M. Cash deals surged, driven by generational wealth transfers. New development sales are strong, and days on market hit a three-year low despite economic uncertainty. (BRICKUNDERGROUND)
Upfront costs may be lower, but NYC rents are rising fast in response to the FARE Act. As landlords are no longer able to shift broker fees to tenants, average rents climbed 15% (from ~$4,750 to ~$5,500) and nearly 2,000 listings disappeared from StreetEasy in the first few days of the law. (NY POST)
Tech hubs in Hudson Yards and Hudson Square are also fueling interest in trophy properties in Downtown Manhattan, especially in Tribeca, SoHo, and the West Village. Ultra-wealthy buyers are drawn to large layouts, high-end finishes, and boutique buildings offering privacy and prestige in a prime location. (WSJ)
NYC is at the forefront of the return-to-office trend, with April 2025 foot traffic only 5.5% below pre-pandemic levels. Major leases, such as Amazon's 330,000 sq ft at 10 Bryant Park and Goodwin Procter’s expansion in Midtown South, reflect strong confidence in the city's business centers. As more professionals return, demand for nearby residential neighborhoods like Midtown, Hudson Yards, and the Financial District is expected to rise. (NYPOST) |
| | | Explore a collection of architectural gems, where timeless design meets refined urban living. |
| | | |
|
|
|
| | | | | | | | | | 3 BD 3 BA 1940 SF $2,500,000 |
|
|
|
|
| | | | | “Isil found me my first home in Manhattan after a very aggressive search. She was confident and professional from Day-1, and she made me feel like her only client. Isil was extremely receptive to my feedback and was sensitive to my "wish list items while also providing market knowledge and insightful feedback throughout the search. I would recommend Isil to anyone looking for a home in NYC.”
-- First-time home buyers who purchased an Upper West Side Coop |
|
|
|
|
| | Office: 646-982-0353 Compass is a licensed real estate broker. All material is intended for informational purposes only and is compiled from sources deemed reliable but is subject to errors, omissions, changes in price, condition, sale, or withdrawal without notice. No statement is made as to the accuracy of any description or measurements (including square footage). This is not intended to solicit property already listed. No financial or legal advice provided. Equal Housing Opportunity. All Coming Soon listings in NYC are simultaneously syndicated to the REBNY RLS. Photos may be virtually staged or digitally enhanced and may not reflect actual property conditions. |
|
|
|
|
|
|